The structure of the molecular gas in galaxies is hierarchical. It has been shown by Rosolowsky et al. (2008) that it is useful to display its essential features as dendrograms - the graphical representations of the topology of the isosurfaces as a function of contour level. We have developed a simple algorithm called DENDROFIND which creates dendrograms as a natural by-product of the clump-finding process. The algorithm is similar to well known CLUMPFIND (Williams et al. 1994), however, its results are less dependent on technical parameters (as for instance the temperature difference between contours). Another advantage, comparing to CLUMPFIND, is that DENDROFIND always produces contiguous clumps (CLUMPFIND may lead to discontiguous structures identified as a single clump in extreme cases).
The DENDROFIND algorithm operates on a position-position-velocity datacube of the brightness temperature Tb. The main loop gradually decreases the temperature level Tl starting from the maximum brightness temperature in the datacube, Tmax, going down to Tcutoff set by user. In each iteration, pixels with Tb > Tl are processed: they are assigned to existing clumps, or new clumps are created and the pixels are assigned to them. Furthermore, information about connections among clumps on level Tl is evaluated and recorded. This information is necessary (and sufficient) to plot the dendrogram at the end of the algorithm. Each clump created by the algorithm has to fulfill the following three conditions: (i) it is a contiguous area in the PPV space; (ii) it consists of at least Npxmin pixels (Npxmin is another user defined parameter); and (iii) the difference between the clump peak temperature and the temperature at which the clump connects to other clumps has to be at least dTleaf.
In summary, the algorithm is controlled by four parameters: Nlevels (number of temperature levels), Npxmin (minimum number of pixels of a clump), dTleaf (minimum difference between the clump peak temperature and the temperature at which it connects to other clumps) and Tcutoff (minimum Tb considered for assignement to clumps). It is always possible to find such Nlevels that using higher values would lead to identical results.
The main part of DENDROFIND is the C code "df" written by R. Wünsch. It depends on the cfitsio library. Less CPU intensive parts of DENDROFIND consist of several python scripts written by R. Wünsch and V. Sidorin. The python scripts use libraries NumPy (Oliphant 2006) SciPy (Jones et al. 2001) and graphical utility gnuplot. The package with all the scripts can be downloaded here:
It includes:
| script | description |
|---|---|
| df_preproc.py | preprocessor; selects subset of datacube, scales Tb, sums up doubles, triples, etc. of channels |
| df.c and df.h | main DENDROFIND code; identifies clumps, creates files clump_grid and clumps |
| df-old.py | old main DENDROFIND code written in python; now replaced by df.c |
| df_renumber.py | renumber clumps according to file NUMBERING |
| df_dendrogram.py | creates gnuplot script for plotting dendrogram |
| df_channel_maps.py | creates gnuplot script for plotting individual channel maps showing identified clumps |
| df_stats.py | calculates clump physical properties (masses, sizes etc.) |
| df_fitsstat.py | calculates some statistical properties (like σnoise) of the fits datacube |
The main DENDROFIND code can by compiled simply by typing make in the directory with all .c and .h files. Other files included in the package are:
| file | description |
|---|---|
| clump.c and clump.h | C module defining functions used by the main DENDROFIND code |
| clump.py | python module defining classes and functions used by several DENDROFIND scripts |
| consts.gp | gnuplot module including some physical constants |
| palette.gp | gnuplot module including definition of the color palette used for plotting clumps |
| README | describes usage of the scripts |
The text below describes the main DENDROFIND code, i.e. the script df.py.
The main DENDROFIND program is controlled by the four following input parameters
| parameter | description |
|---|---|
| Nlevels | number of temperature levels |
| Npxmin | minimum number of pixels of a clump |
| dTleaf | minimum difference between the clump peak temperature and the temperature at which it connects to other clumps, i.e. minimum length (in temperature) of a dendrogram leaf |
| Tcutoff | minimum Tb considered for assignement to clumps |
Setting Nlevels is straightforward, it should have a value for which further increase of it does not lead to different results. A value of Npxmin depends on the resolution of the instrument (or the numerical method) and it should correspond to the number of pixels of the smallest resolvable structure. Finding values of dTleaf and Tcutoff is not so obvious. Fortunatelly, the dependence of results on this two parameters is quite intuitive: decreasing the value of dTleaf leads to higher number of identified structures (as it is easier for local maxima to become independent clumps); and decreasing the value of Tcutoff leads to higher fration of the datacube to be assigned to clumps (and in most cases also to higher number of clumps). In many cases, the reasonable values for the both parameters can be set as some multiple of the noise dispersion, for instance dTleaf = Tcutoff = 3σnoise.
The most important data structures for the algorithm are the two 3D arrays Tgrid and clump_grid and the list clumps. The Tgrid array is a copy of the PPV data cube including the brightness temperature Tb for each pixel px. The clump_grid array has the same dimensions as Tgrid, and it includes, for each pixel px, the ID number of a clump to which pixel px is assigned (-1 means that the pixel is not assigned to any clump). The list clumps includes objects of class c_clump. Each such object includes all information about the identified clump. In particular it is the clump ID number, the position and value of the clump peak temperature, the list pixels of pixels that are assigned to the clump, the list touching of clumps that directly touch the clump, and the list connected of clumps that are are connected (even through other clumps) to the clump. The lists touching and connected also record information about the temperature at which the clump is touching or connected to other clumps. Another important variable is the list neigh which includes ID numbers of clumps neighbouring with the processed pixel. In a recent version of the code, neighbours of pixel px are defined as pixels which share with px a face, i.e. each pixel has six neighbours. However, a simple single modification of the code can change the behaviour so that any other pixels (for instance diagonal ones) are also taken into account as neighbours.
| variable | description |
|---|---|
| Tgrid | 3D array (PPV) of the brightness temperature |
| clump | grid 3D array (PPV) of clump ID numbers |
| clumps | list of clump objects |
| neigh | list of IDs of clumps neighbouring with a processed pixed |
| len(neigh) | length of the neigh array |
| Tl | actual brightness temperature level in the main loop |
| px | index of the processed pixel (in the code i,j,k) |
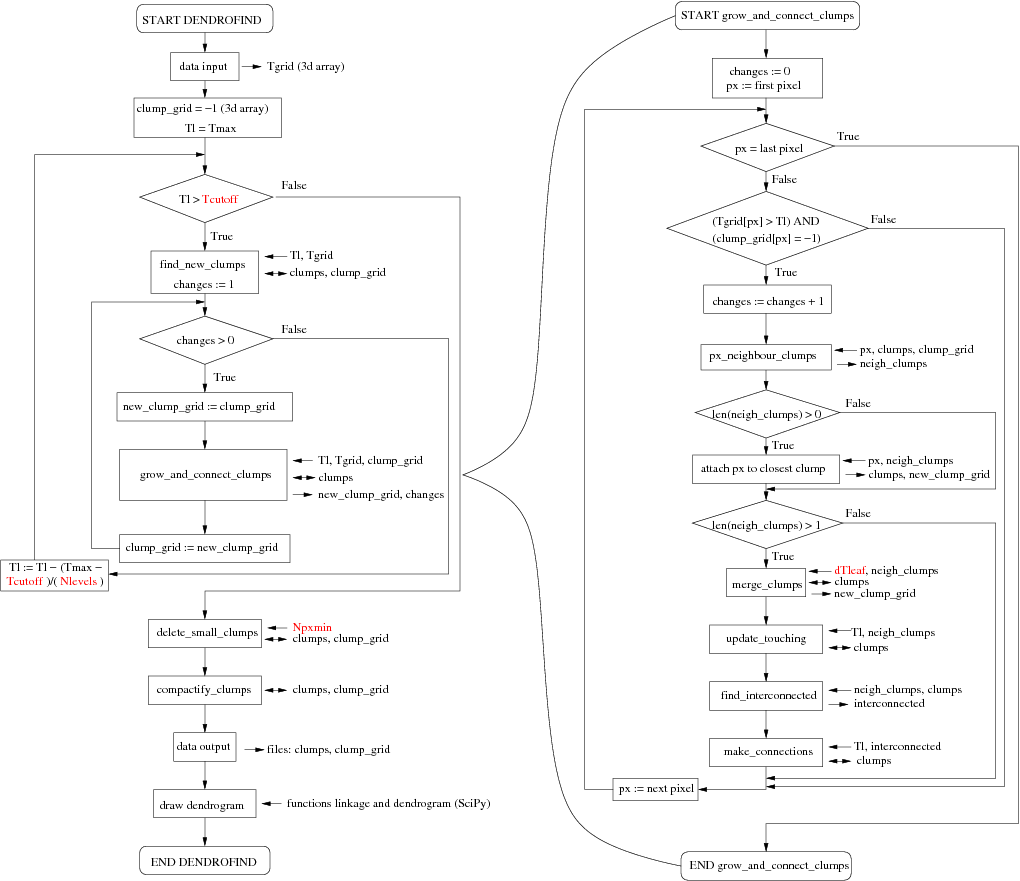
Figure 1. The DENDROFIND flowchart. The input parameters are printed in red
color. Left and right arrows with variables next to the boxes with algorithm
functions show input and output to/from this function, respectivelly. Double
head arrows denote variables used for both input and output.
The algorithm starts by reading the data from the fits file and creating the array Tgrid (see Figure~\ref{fig:flowchart}). Then the array clump_grid is created and the value -1 is assigned to all its pixels. Consequently, the maximum brightness temperature Tmax is determined and the main loop of the algorithm is entered. It executes Nlevels iterations decreasing the variable Tl from Tmax to Tcutoff.
In each iteration of the main loop, all pixels px with Tgrid(px) > Tl and clump_grid(px) = -1 are processed in several sweeps through the Tgrid array. In the first sweep, a new clump is created for each processed pixel which is the local maximum (i.e. Tgrid(px) is greater than Tgrid of all px neighbours). The unused ID number is found and assigned to clump_grid(px) and a new clump object is created and added to the list clumps. In next sweeps, processed pixels which are not local maxima are assigned to existing clumps and connections among clumps are found (see description of function grow_and_connect_clumps below). In order to make the procedure independent on the order by which the pixels are processed in one sweep, information about pixel assignements to existing clumps is writen into a copy of the clump_grid array new_clump_grid. At the end of the sweep, new_clump_grid is copied back to clump_grid and another sweep is made until no assignement occurs (this is controled by the variable changes).
The grow_and_connect_clumps function consists of several steps executed for each processed pixel (the one with Tgrid(px) > Tl and clump_grid(px) = -1). At first, all clumps to which neighbour pixels of the processed pixel belong are identified and stored in the list neigh. If neigh includes at least one clump, the processed pixel px is assigned to the clump from neigh whose peak is closest to px. Further, if the neigh list includes more than one clump, four steps are executed. Firstly, clumps from the neigh list with Tpeak - Tl < dTleaf, where Tpeak is the peak temperature of the clump, are merged to the clump from the neigh list with the highest Tpeak. Then, lists touching of all clumps in the neigh list are updated so that each clump includes all the other clumps from the neigh list on its touching list. As the next step, the interconnected list of all clumps which can be reached from the pixel px by moving through neighbour pixels only with the temperature always greater than Tl is found. Finally, the connected lists of all clumps are updated so that each clump includes all the other clumps from the interconnected list on its connected list.
At the end, after the Tcutoff limit is reached, clumps with smaller number of pixels than Npxmin are deleted and all clumps are renumbered so that their IDs are consecutive. Then, the array clump_grid and the list clumps are writen into files. Finally, SciPy functions linkage and dendrogram are used to create the dendrogram. The function linkage organizes clumps into the hierarchical clusters based of their lists connected. The function dendrogram actually plots the dendrogram, i.e. finds the exact positions of the dendrogram lines in the figure.
Jones, E., Oliphant, T., Peterson, P., et al. 2001, SciPy: Open source scientific tools for Python, http://www.scipy.org/
Oliphant, T. 2006, Guide to NumPy (Trelgol Publishing, USA), http://numpy.scipy.org/
Rosolowsky, E. W., Pineda, J. E., Kauffmann, J., & Goodman, A. A. 2008, ApJ, 679, 1338
Williams, J. P., de Geus, E. J., & Blitz, L. 1994, ApJ, 428, 693